Analyzing PostgreSQL RDS Workload with pgbadger
Author: Shailesh Rangani | 7 min read | January 29, 2020
As a DBA, you need to understand how PostgreSQL RDS is performing as whole for any given period, specifically during peak hours. It is very important to get insight of database load, application traffic, connections, sessions, check points, long running SQLs, Most frequent queries, type of queries, candidate SQLs for tuning, frequent warnings/errors and other patterns of events.
After enabling various database parameters at the database level, all of the details will get logged in PostgreSQL RDS logs. But it is tedious to go through all logs and each line one by one. It will more useful if these logs can be transformed into nice reports and graphs which give information on how the database is performing and what the current bottlenecks are. AWS provides RDS performance insights but pgbadger comes in handy in understanding some of the above details with PostgreSQL.
pgbadger – Log analyzer/parsing tool
pgbadger is open source log analyzer for PostgreSQL written in Perl. It takes PostgreSQL logs as input and based on other parameters given as argument, it generates a nice HTML report for analysis and insight of PostgreSQL database. This report is helpful in finding all sort of errors, warnings and events (if any) occurring on PostgreSQL database system. The report provides insight on connections, sessions, checkpoints, temp files, vacuums, locks, slow queries and many other events.
Generating the pgbadger report from RDS is little different than a traditional method since there is no direct access to PostgreSQL log files, unlike EC2 instance or PostgreSQL on VM. These log files can be downloaded using AWS CLI or AWS console (if there is access to console). There are also AWS scripts available to download these logs to EC2 or to S3 for longer retention.
This document covers high-level steps on how to generate pgbadger for PostgreSQL running on AWS RDS.
It is assumed that pgbadger and AWS CLI is installed on local desk or EC2 instance from where pgbadger report will be generated.
pgbadger installation steps can be referenced from
https://github.com/darold/pgbadger
1. Enabling Required Monitoring
Before you start using pgbadger it is important to make sure all information is logged into PostgreSQL log files so it can be picked up by pgbadger and available in HTML report.
Below are few of parameters which can be good starting point. Start with small amount of logging to avoid overhead on RDS.
log_checkpoints = on

log_connections = on

log_disconnections = on

log_lock_waits = on

log_temp_files = 1

log_autovacuum_min_duration = 0

log_error_verbosity = default

log_statement = all

lc_messages='C'

log_min_duration_statement=100m (Modify this based on need)

rds.force_autovacuum_logging_level = 'log'
Note: Each of these parameters come with its own overhead since information gets logged every time any of these events occurs.
These parameters can be changed directly in parameters group using AWS console for given RDS instance or one can use AWS CLI to change these parameters.
aws rds modify-db-parameter-group \

--db-parameter-group-name $parameter_group \

--parameters "ParameterName=log_checkpoints,ParameterValue=on,ApplyMethod=immediate" \

"ParameterName=log_connections,ParameterValue=on,ApplyMethod=immediate" \

"ParameterName=log_disconnections,ParameterValue=on,ApplyMethod=immediate" \

"ParameterName=log_lock_waits,ParameterValue=on,ApplyMethod=immediate" \

"ParameterName=log_temp_files,ParameterValue=0,ApplyMethod=immediate" \

"ParameterName=log_autovacuum_min_duration,ParameterValue=0,ApplyMethod=immediate" \

"ParameterName=log_error_verbosity,ParameterValue=default,ApplyMethod=immediate" \

"ParameterName=log_statement,ParameterValue=all,ApplyMethod=immediate" \

"ParameterName=lc_messages,ParameterValue='C',ApplyMethod=immediate" \

"ParameterName=log_min_duration_statement,ParameterValue=100ms,ApplyMethod=immediate"\"ParameterName= rds.force_autovacuum_logging_level,ParameterValue=’log’,ApplyMethod=immediate"\
RDS instance restart/reboot may require depends on which parameters is being modified.
2. Let This Information Get Into RDS Logs
Since all required monitoring is enabled, just wait and watch the transaction information logged into RDS logs. Make sure to keep watching database performance and size of RDS logs while application transactions are getting performed.
3. Validate PostgreSQL Logs Getting Generated
If there is no direct AWS console access to AWS RDS then using AWS CLI, you can validate logs using below command.
Note: Make sure AWS CLI is configured prior to executing below command.
$ aws rds describe-db-log-files --db-instance-identifier <<RDS_INSTANCE>> | jq -r '.DescribeDBLogFiles[] | .LogFileName'
error/postgres.log
error/postgresql.log.yyyy-mm-dd-20
error/postgresql.log.yyyy-mm-dd-21
error/postgresql.log.yyyy-mm-dd-22
error/postgresql.log.yyyy-mm-dd-23
error/postgresql.log.yyyy-mm-dd-00
4. Extract Logs From AWS RDS to Local EC2/UNIX Server
Now it is time to extract these logs to local desk or EC2 server.
Using AWS CLI, these logs can be extracted to local desk/EC2/UNIX system. If you are looking for a longer duration of retention, these logs can be sent to an S3 bucket and pulled from S3 to EC2 via AWS CLI.
$ for filename in $( aws rds describe-db-log-files --db-instance-identifier <<RDS_INSTANCE>> | jq -r '.DescribeDBLogFiles[] | .LogFileName' )

do

aws rds download-db-log-file-portion --db-instance-identifier <<RDS_INSTANCE>> --output text --no-paginate --log-file $filename  >> /data01/$filename

done
$ ls -ltr
total 1480
-rw-rw-r-- 1 psqldev psqldev 1849 postgres.log
-rw-rw-r-- 1 psqldev psqldev 507606 postgresql.log.yyyy-mm-dd-20
-rw-rw-r-- 1 psqldev psqldev 11390 postgresql.log.yyyy-mm-dd-21
-rw-rw-r-- 1 psqldev psqldev 4926 postgresql.log.yyyy-mm-dd-22
-rw-rw-r-- 1 psqldev psqldev 3903 postgresql.log.yyyy-mm-dd-23
-rw-rw-r-- 1 psqldev psqldev 3903 postgresql.log.yyyy-mm-dd-00
5. Execute pgbadger Against PostgreSQL Logs
Since all required logs are now available in EC2 instance, pgbadger can be executed against these logs. pgbadger has various options as argument and can be use based on need.
$ pgbadger --help
Usage: pgbadger [options] logfile [...]
PostgreSQL log analyzer with fully detailed reports and graphs.
Arguments:
logfile can be a single log file, a list of files, or a shell command
returning a list of files. If you want to pass log content from stdin
use - as filename. Note that input from stdin will not work with csvlog.
In this example, pgbadger has been executed for one hour of timeline. 23:45 to 00:45 for a given date. You can also take pgbadger for the entire day and analyze your workload.
$ pgbadger -f stderr -p '%t:%r:%u@%d:[%p]:' -b " yyyy-mm-dd 23:45:00" -e " yyyy-mm-dd 00:45:00" /data01/postgres/pgbadger_logs/error/postgresql.log* -o pgbadger.html

[========================>] Parsed 2198308923 bytes of 2198308923 (100.00%), queries: 1411842, events: 65

LOG: Ok, generating html report...
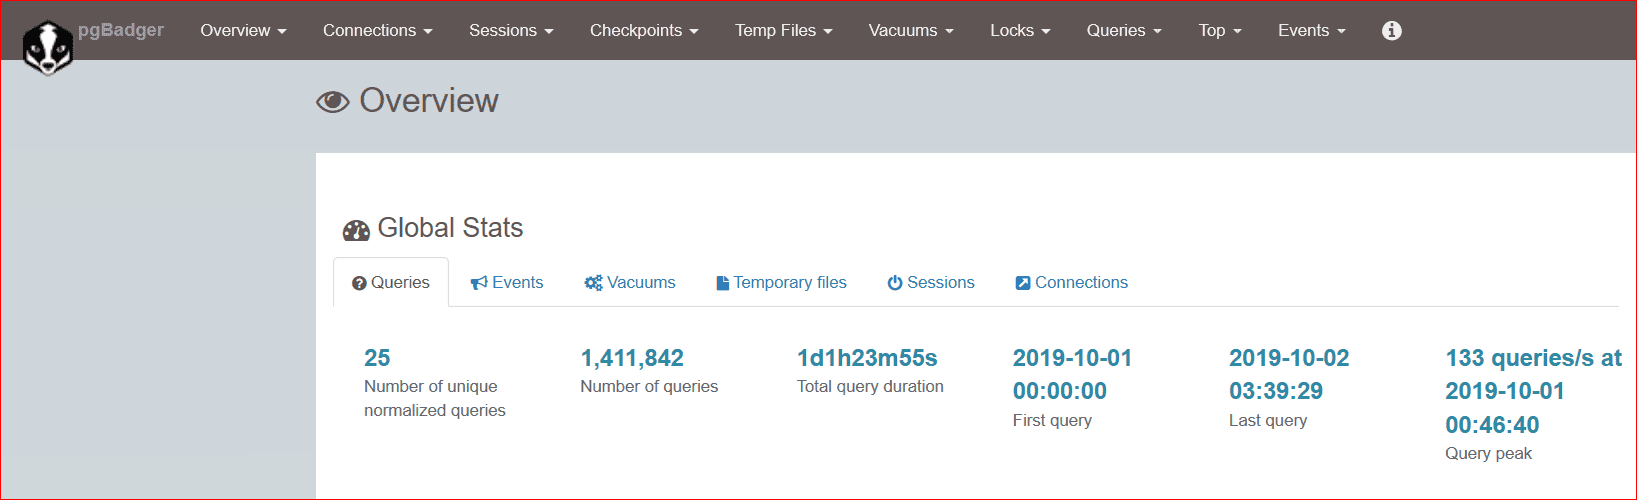
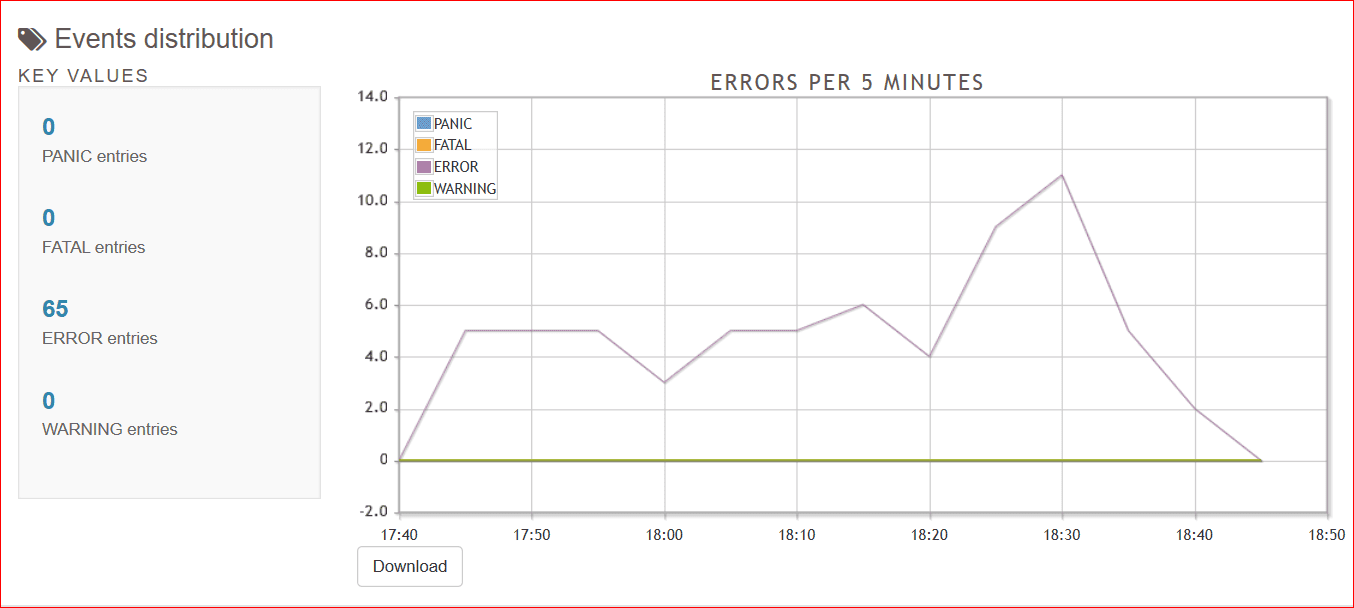
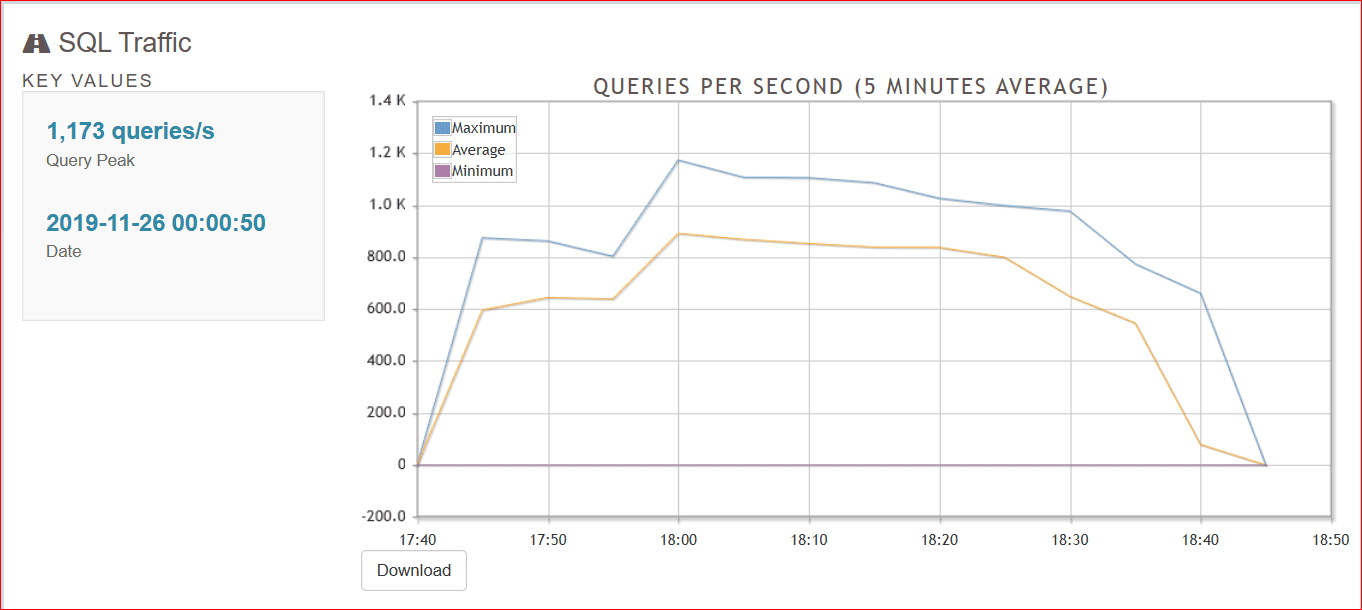
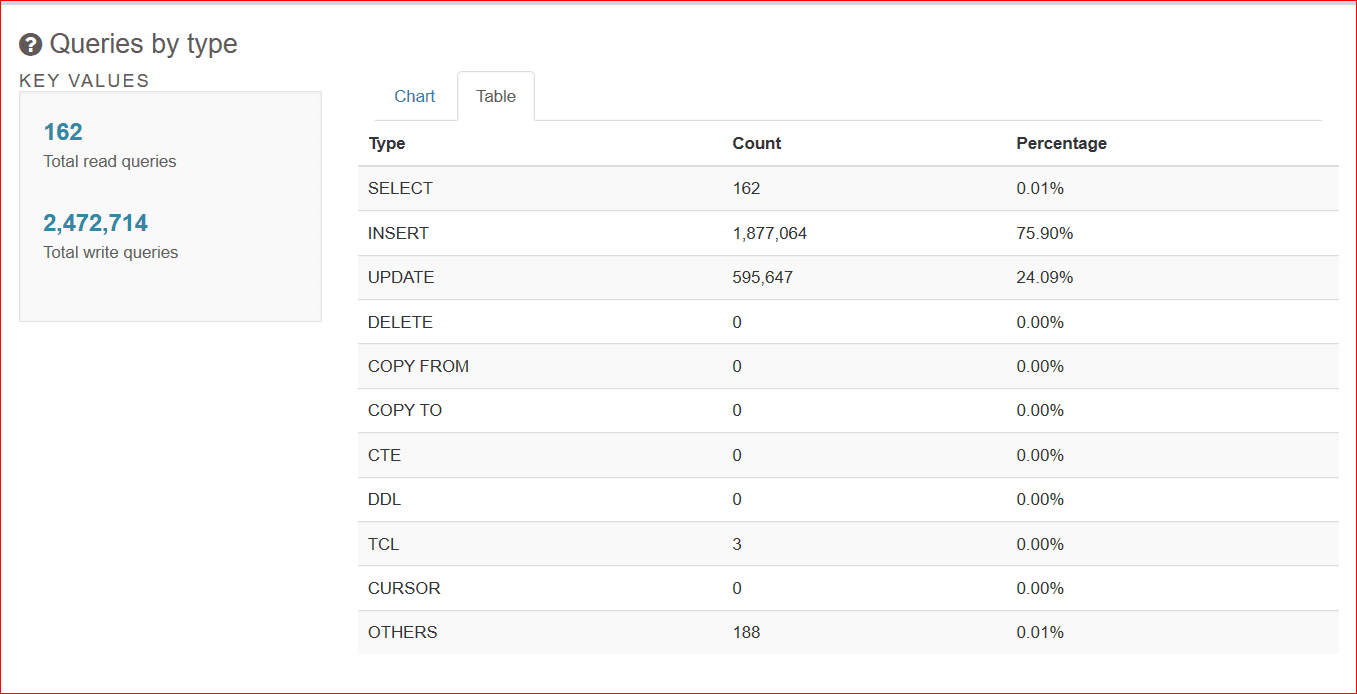
Once the pgbadger report is generated. You will be able to understand your database load with more details in terms of type of SQLs, most used queries, workload type, peak hours, etc.
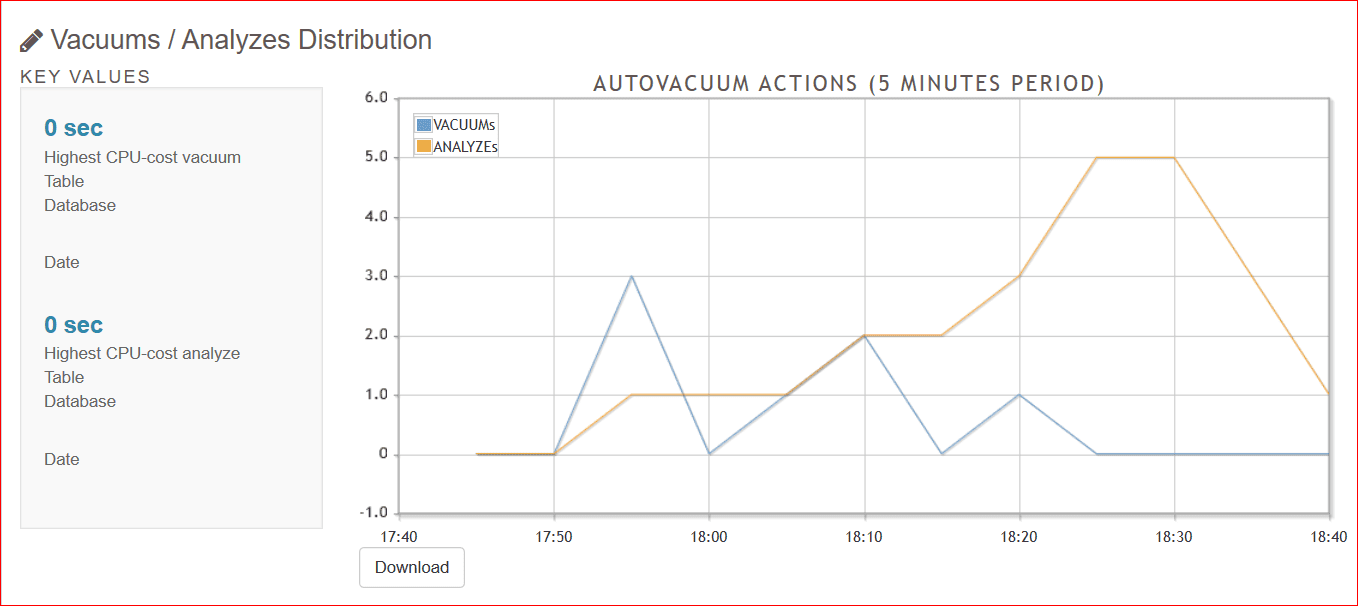
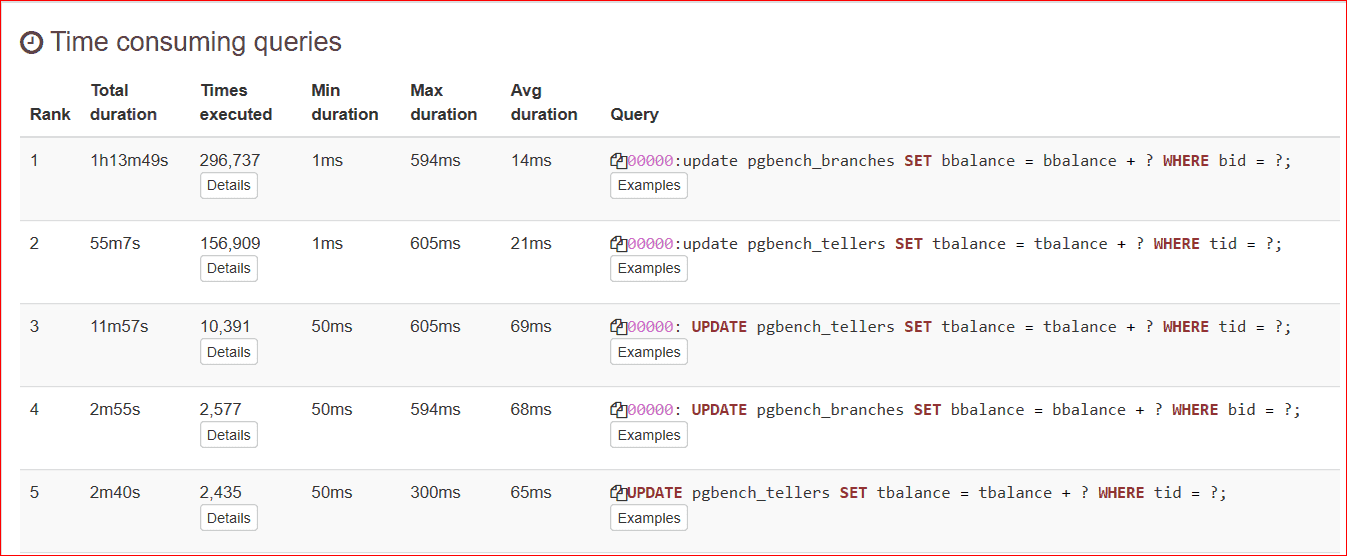
6. Sample pgbadger Report/Graphs
Below is snippet of pgbadger report graphs.
Conclusion
To get insight of PostgreSQL database workload, pgbadger is great tool to start with. It is free and easy to install and configure. You can also schedule pgbadger reports via available scheduler like Cron, so you have pgbadger report every day to go through and plan for continuous improvements on database performance area. pgbadger detects log format automatically and charts can be saved as image directly and use for presentation.
If you’re looking for assistance with running PostgreSQL on RDS we can help you with a strategy, contact us to learn more.