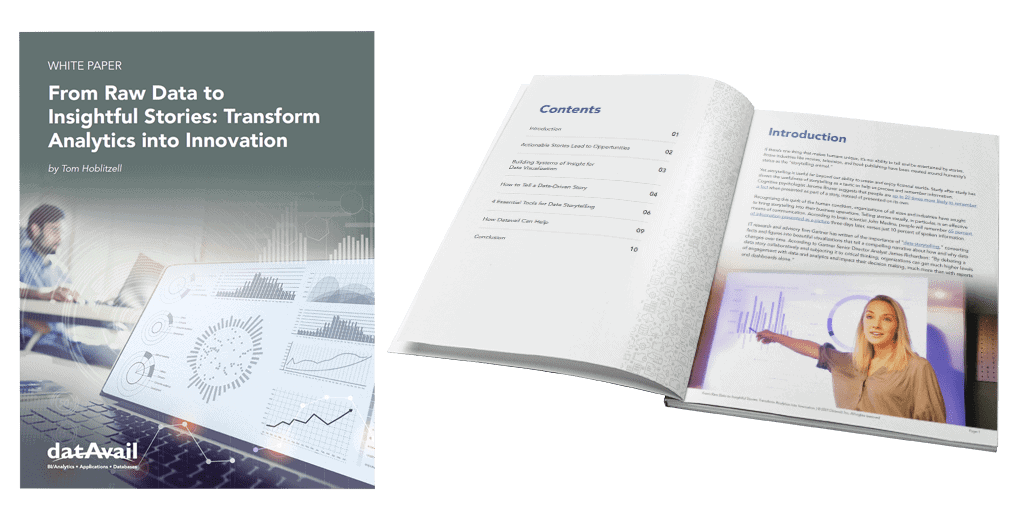
From Raw Data to Insightful Stories: Transform Analytics into Innovation

Business Intelligence and Data Visualization drive innovation by turning raw data into meaningful insights.
What is Data Visualization?
Data visualization takes raw data and transforms it into easy-to-understand visual content used for data-driven decision making. These visualizations come in many forms and focus on bringing meaning to the organization’s data. This content is frequently offered as part of a report, presentation, or interactive dashboard.
Examples of data visualizations include bar and pie charts, scatter plots, infographics, maps, tables, density plots, Venn diagrams, and tree maps. The benefits of using business intelligence and data visualization solutions include:
- Improving business analysis
- Boosting business agility
- Discovering patterns in the raw data
- Getting more context for business insights
- Finding new opportunities
Work with Datavail to Take Your Reporting to the Next Level
Did you know that research has shown that people are up to 22 times more likely to remember a fact when presented as part of a story, rather than on its own? Organizations are looking for ways to bring storytelling into their own business operations to take advantage of that fact. When you tell stories visually, you improve recall even more. People remember 65 percent of information from a picture three days later, compared to only 10 percent with spoken information on its own.
How can you achieve effective data-driven storytelling for your own organization and make changes to your operations based on insights you weren’t able to see before?
This white paper will discuss:
- How you can transform data for business forecasting and planning
- How to turn information into clear, actionable metrics and insights that help you chart a path for the future direction of your business
Fill out the form to download the white paper and dive into BI and data visualization.
You need more than business intelligence tools to create powerful and actionable data visualizations. We can help you get the most out of your data so you can focus on making the best decisions. Our data visualization services include identifying important business drivers and KPIs, cleaning your data sets, training your data team to use your data visualization tools, choosing the right BI solution for your use cases, and creating optimal visualizations.
Download the White Paper