SQL on Linux: Exploring the System Utilities on Linux
Author: JP Chen | 4 min read | October 15, 2019
In Windows, we use the Task Manager to view the apps and processes and their CPU, Memory, Disk, and other utilizations details. We use Performance Monitor to view the live stats and performance of the system counters. What are the similar utilities for us do the same on Linux? While there are plentiful of tools you can use, we will explore 3 of the most popular ones: htop, glances, and iostat.
Using htop
Htop is an enhancement of another system monitoring tool called top. It allows you to monitor all processes running on the system. It is an interactive tool and allows you to kill a process, configure nice, sort columns, search for processes, and a lot more.
To use explore htop, perform the following steps:
1. Download and install htop if not already installed:
sudo apt-get update

sudo apt-get install htop
Key in your password when prompted.
2. Open htop:
htop
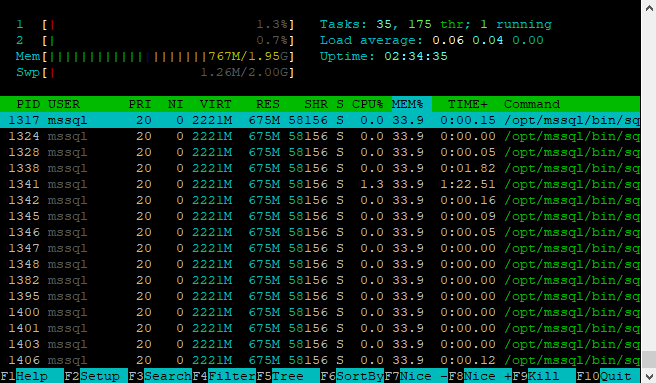
Figure 6-1: htop
3. Look at the upper left corner, you will see the CPU, Mem, and Swp details.
4. Look at the upper right corner, you will see the Tasks, Load average, and the system Uptime.
5. Click on the “CPU%” column to sort the processes by the percentage CPU time currently using.
6. Look at the bottom of the screen, you will see different functions and there F-keys to invoke them.
7. Press F10 to quit.
Using glances
Glances is a cross-platform system monitoring tool. Yes – you can run it on Linux and on Window. You can use glances to monitor CPU, load, memory, network rate, disk i/o, and file system. Glances shows 4 different types of colors for various statistics: Green – OK, Blue – attention, Violet – alert, Red – critical. You can adjust the thresholds by modifying the configure file located in /etc/glances/glances.conf.
To use explore glances, perform the following steps:
1. Download and install glances if not already installed:
sudo apt-get update

sudo apt-get install glances
Key in your password when prompted.
2. Open glances:
glances
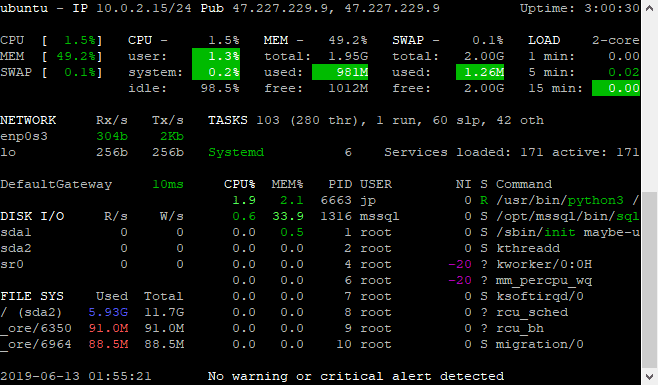
Figure 6-2: glances
3. Press c to sort process by CPU.
4. Press m to sort process by MEM.
5. Press i to sort processes by I/O rate.
6. Notice that you can view the File System space usage in the “File SYS” section.
7. Press q to quit.
Using iostat
Iostat is a system monitor tool that can be used to collect and show operating system storage input and output statistics. It is often used to identify storage devices performance issues. The storage devices can be local disk or remote disks.
To use explore iostat, perform the following steps:
1. Download and install iostat if not already installed:
sudo apt-get update

sudo apt-get install sysstat
Key in your password when prompted.
2. Open iostat:
iostat
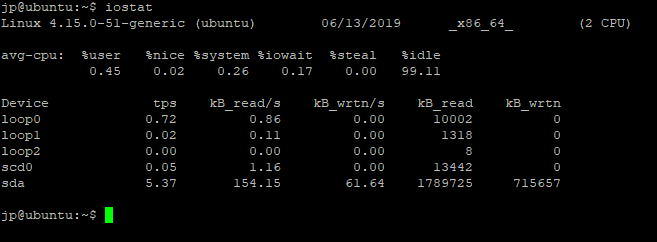
Figure 6-3: iostat
3. Notice that the first section contains the CPU report.
4. Look at the device utilization report in the second section. Tps is the number of transfers per second.
5. Convert the iostat to show report in megabytes unit:
iostat -m
6. Create a delay to view the trend:
iostat -m 5 3
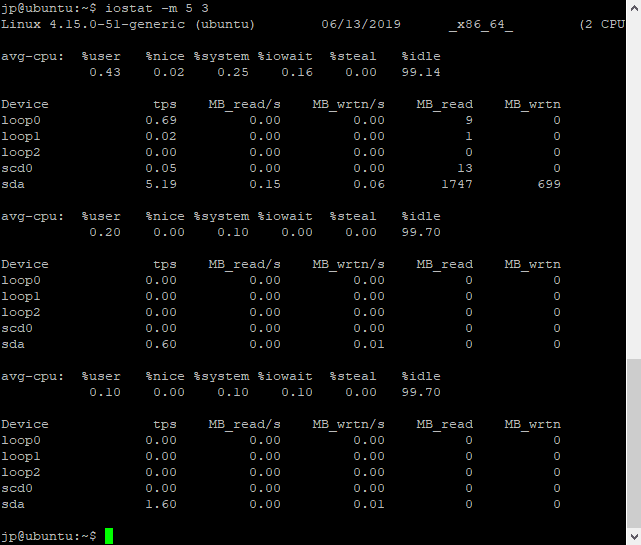
Figure 6-4: iostat with MB unit, 5 seconds interval with 3 times reports
Read This Next
SQL on Linux: Building Your Own SQL on Linux Lab
If you’re a SQL Server data professional interested in running in SQL on Linux and don’t know where to start, this white paper is for you. SQL Server expert, JP Chen details the essential steps to take including downloading and installing of the required software to build your own SQL on Linux lab on Windows PC.