Performance troubleshooting with SQL Server 2016 Live Query Statistics
Author: Eric Russo | 3 min read | November 25, 2015
Exploration is something we all do when a new releases come of a software. Along with many new features in SQL Server 2016, one of the developer and DBA friendly features is Live Query Statistics. If you are a DBA or developer, there must have been situations where a query takes a long time to execute and “actual” query plan can only be seen once execution is completed. There are multiple ways to enable the feature.
SQL Server Management Studio
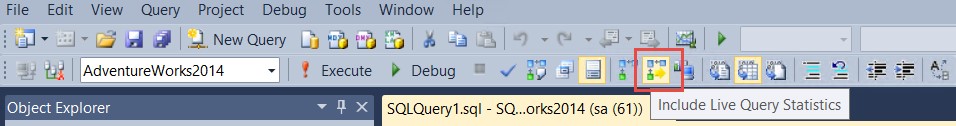
As shown in screenshot below, highlighted is a small button which enables this feature of Live Query Statistics. In real life of troubleshooting slow query performance, this would be a very powerful feature. We can get the query plan when the query is actually executing. We can get insights into the execution plan and which part of the plan is getting executed at the given point of time.
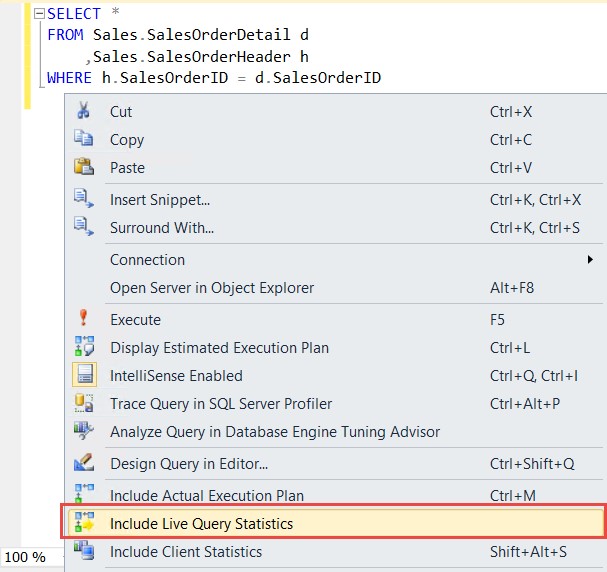
It can also be enabled by right clicking on the query window and choose same option.
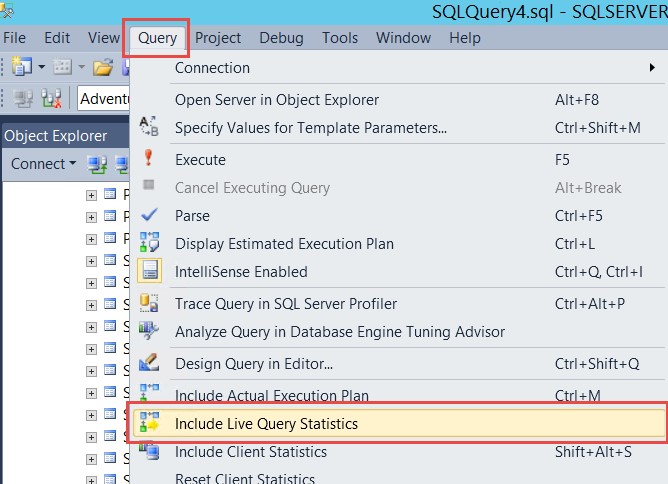
Also you can do this from the menu bar by clicking on “Query.”
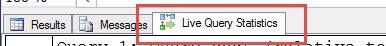
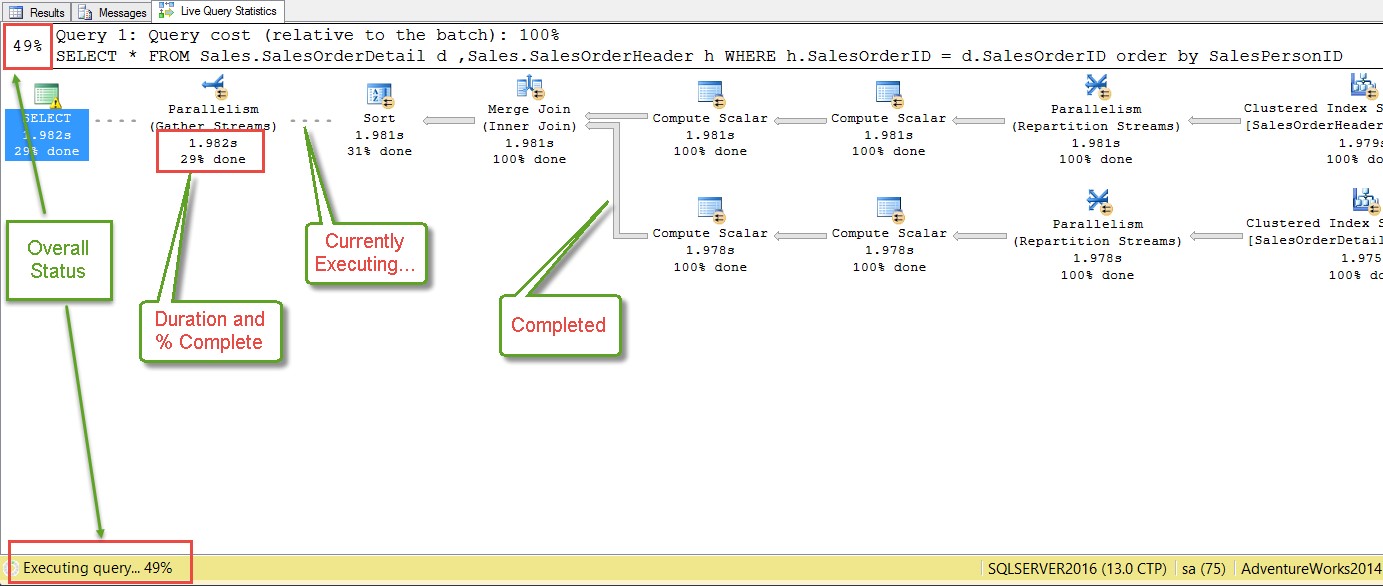
Once it’s enabled and the query is executed, we would see a new tab when query is running called “Live Query Statistics” shown in the image below.
Here is the sample query which we have executed:
SELECT *
FROM Sales.SalesOrderDetail d
	,Sales.SalesOrderHeader h
WHERE h.SalesOrderID = d.SalesOrderID
This would need AdventureWorks sample database, which can be downloaded from http://msftdbprodsamples.codeplex.com/ .
As we can see, it provides “live” execution plan and displays various things:
- Overall query progress/status.
- Run-time execution statistics such as elapsed time.
- Progress of operator (% completion and time taken.)
Number of rows processed.
Activity Monitor
If we right click on server in SSMS, we have an activity monitor. If you notice in the screen below, a new grid is seen as compared to older versions of SSMS – “Active Expensive Queries.” We can see the live plan if we right-click a query and click on the “Show Live Execution Plan” option.
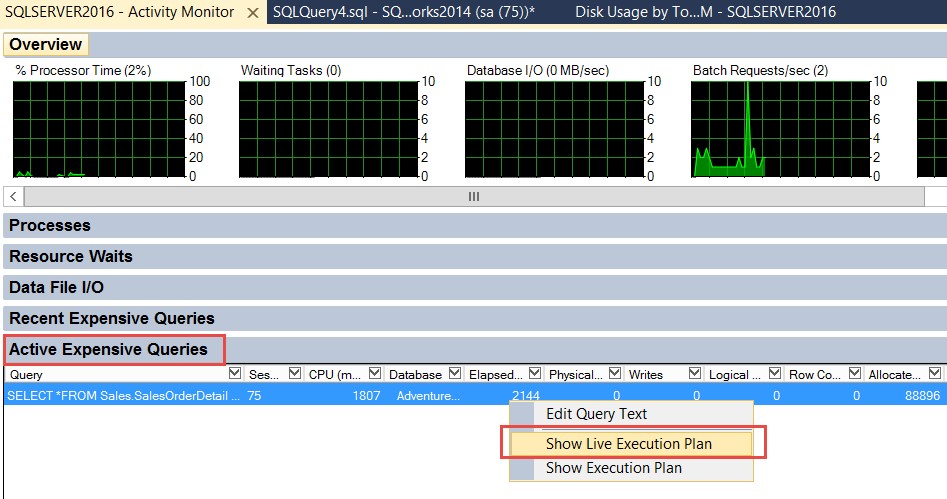
This option is a little tricky. To get the live plan from activity monitor, the query has to be run with “SET STATISTICS XML ON” or “SET STATISTICS PROFILE ON.” Now, you might wonder how we can see the queries live plan when its coming from application? For that query_post_execution_showplan extended event has to be enabled. Once enabled, we can see the plan for all queries which are executing on server. It must be noted that this is a developer kind of tool and should be used with care on the production server.
How it works? If you are wondering what is happening behind the scenes, it is actually a visual representation of data available in DMV sys.dm_exec_query_profiles. This is documented in books online.
Is it only for SQL Server 2016? Well, the good news is that this feature would work if we connect to SQL Server 2014 instance having at least Service Pack 1 because the DMV which is used by this feature is available in SQL Server 2014 also. But if we connect to any lower version, it would be disabled.
In summary, the Live Query Statistics feature allows us to take a look at how the query is getting executed and to find out where the bottlenecks operator. It gives us animated way to detect expensive operations.