What You’re Missing When You Can’t Visualize Your Data Part 1
Author: Bill Anderson | 4 min read | October 25, 2017
What happens when you can’t see your data? If you don’t have an easy, interpretable, analytics view of your data, how can you improve your operation? How do you know what is working and what is not working?
How would you set prices under these circumstances? You wouldn’t know the cost of any of the inputs or the prices of competing products or services. How would you be able to plan for your needs if you couldn’t see what’s happening now or in the past? That’s what it’s like being “data blind.” You can’t make any decisions, do any planning, or evaluate processes and make improvements.
Datavail has released a new white paper entitled, Are You Data Blind? How Good Data Visualization Delivers Business Solutions Faster, which examines in depth the benefits of data visualization solutions such as Oracle Data Visualization Studio, Tableau, Qlik and Oracle BICS. In this post, we’ll help you see what you’re missing if you’re making decisions based on tables of numbers rather than visual representations of numbers that highlight important trends.
Data Visualization at the Speed of Thought
A major benefit of migrating to a business intelligence (BI) or data visualization (DV) solution is the speed at which data can be understood. How long does it take for a restaurant to see that the average ticket is declining? How long will it take for a production company to realize they will run out of inventory soon as a result of surging sales? Many business disasters are predicted first through data. Many business opportunities are missed because decision makers don’t see the opportunity until it’s too late. In data analysis, time matters.
There is a difference between crunching the numbers and seeing the numbers. Looking at the images below, can you determine if the company’s operations are growing month-to-month?
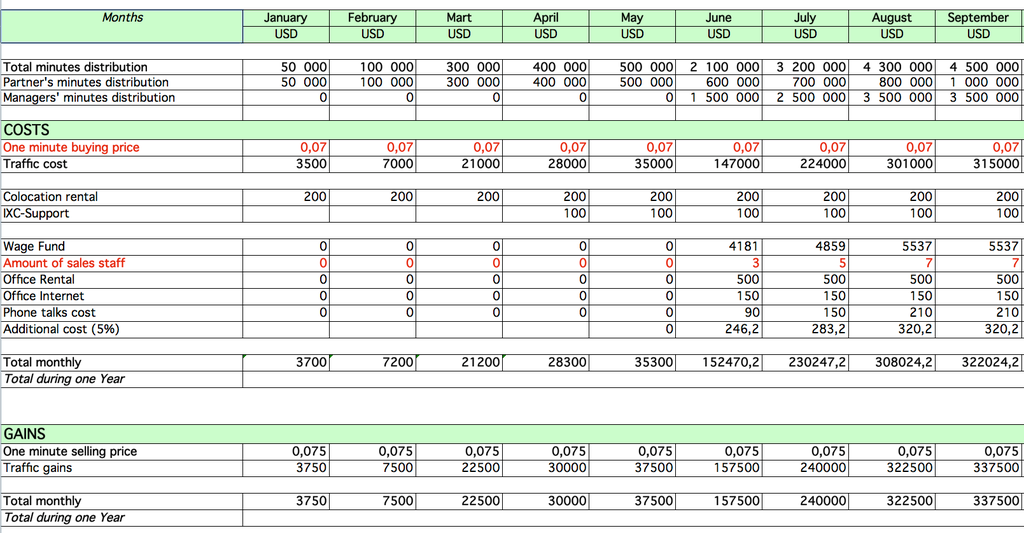
Spreadsheet, used under license from Wikimedia
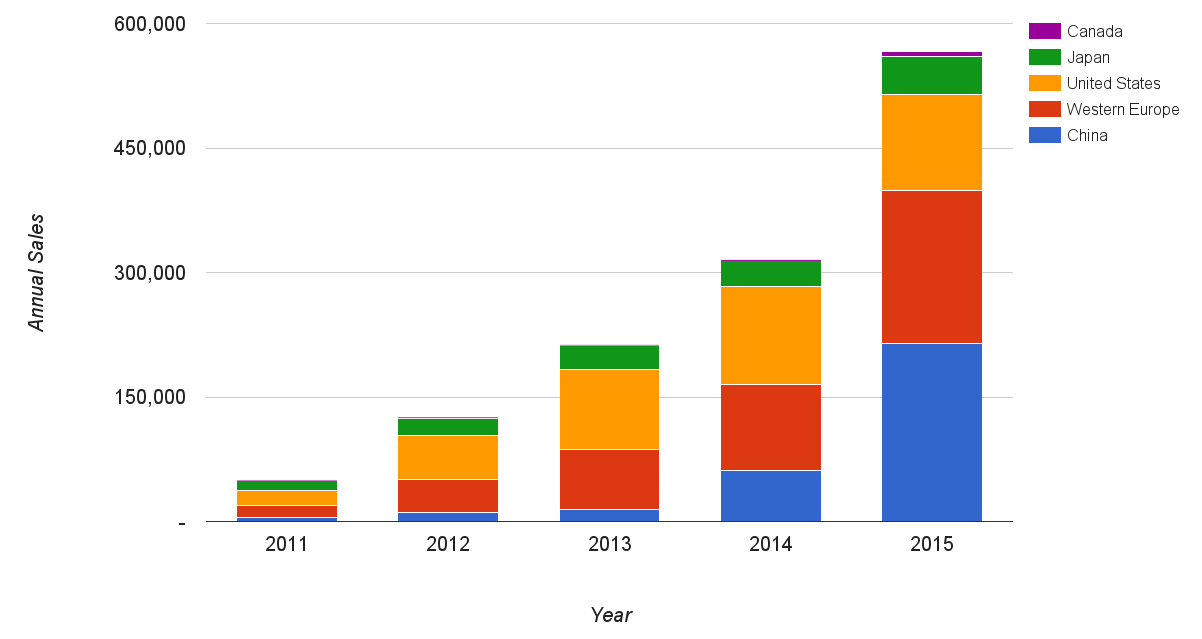
Sales chart, used under license from Wikimedia
From both images, you can determine that operations are indeed growing. However, you can determine that from a quick glance at the second graphic, while the first graphic requires analysis and calculation to verify the growth trend. This is the thing about data visualization: trends jump out at you. They don’t need to be calculated — they can simply be seen.
Most data visualization systems provide closed-loop, real-time data analytics. That means all the users of the system are using the same system and seeing the same data. Imagine a meeting where you want to see a regional breakout of the sales totals. With a DV system, ask and you shall see.
With a manual system, you must call down to IT and ask if you can get regional splits on sales. Then you wait for a report to be generated, which may be incomplete because it’s either based on estimates or because the various divisions are keeping separate books.
Data Visualization is the Forest and the Trees
With manual systems, such as spreadsheets, it can be difficult if not impossible to spot something unusual in the totals and drill down into the source numbers to see what’s up. Is it an error, a fraud, a bug, a trend, a problem, a major shift, or a big mistake? With DV, you have a magnifying lens that allows you to see the most important information immediately, and then drill down through the layers of reporting to the individual transactions, if necessary, to see what’s going on.
Riding Data Visualization to Organizational Success
If you would like to get the benefits of data visualization and business intelligence systems, Datavail can help. We have experts in installing, maintaining and using a variety of BI and DV systems, include Oracle BICS, Tableau and Qlik. We are experts at setting up and testing systems, migrating data, and documenting ROI.
If you are using DV and you aren’t getting what you expected from the system, we can help. There are ways to maximize your data visualization investment to ensure you are getting the most out of what you’ve bought. Datavail has consulting experts with years of experience working with data visualization applications and building custom dashboards and reports. We can help you get better business solutions faster.
At Datavail, we have successfully completed DV and BI projects for customers large and small. Contact us today and get on the path to better visuals, better reporting, and better decisions.