What You’re Missing When You Can’t Visualize Your Data Part 2
Author: Bill Anderson | | October 31, 2017
In the continuation of my last blog post on data visualization, let’s talk about security, look at some more examples of good vs. bad data visualization, and discuss how all of these things lead to solid business decisions that can bolster revenue.
Fraud and theft are rare in large enterprises, but they do happen. They happen much less in BI and DV systems because they literally set off warning bells. Users can set thresholds for alerts or can simply ask to be alerted to “unusual activity” and let the BI monitor for strange transactions. People intent on committing fraud will look for weaknesses to exploit and for ways to cover their tracks. The weaknesses are abundant in manual systems. With BI and DV, the team of auditors is built into the system.
The ability to see totals and trends at a glance, while being able to instantly look at the underlying transactions, is a major advantage of data visualization (DV). Take a look at the two dashboards below. Which would you rather work with?
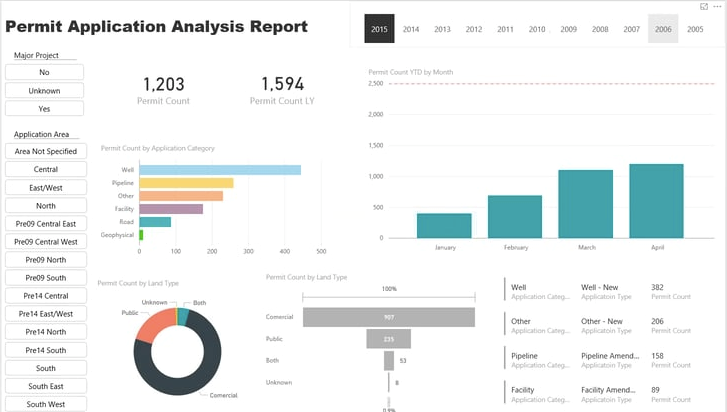
Power BI Dashboard showing analysis of permit activities. Image used with permission.
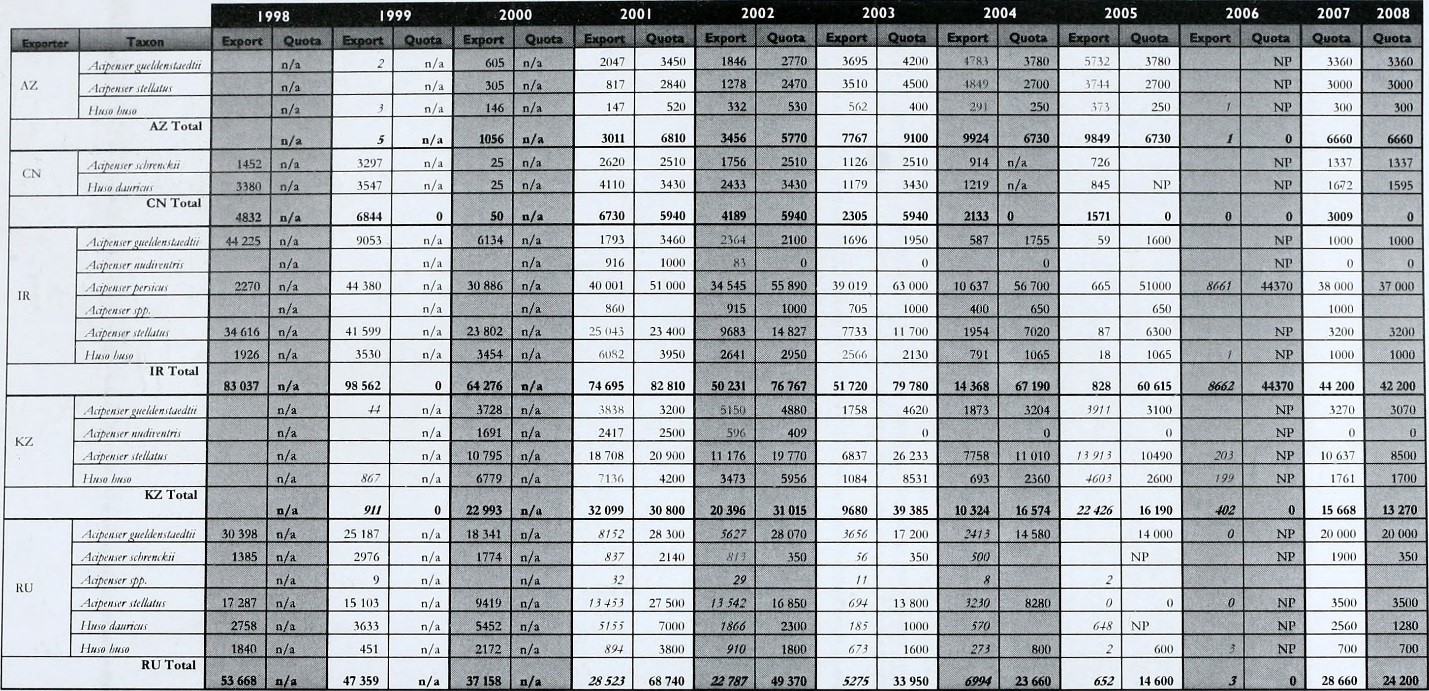
Spreadsheet showing analysis of permit activities. Image used under Wikimedia license.
_(18142403156).jpg)
Good Data Visualization Leads to Confident Decision Making
When you can see trends and have access to underlying data in real-time, decisions are a lot easier to make and they are a lot more accurate. You can discuss what to do with your colleagues, and if they are system users with the right access permissions, they can see the same data you’re seeing at the same time on their own dashboard.
You can discuss scenarios and run them in seconds:
- What happens if interest rates rise a half point?
- What happens if December is 10 degrees warmer than average?
- How much per retail outlet will it cost to build a new distribution center?
With good DV, team members can easily share reports from remote locations. You can see who on the team has looked at a report — and who hasn’t — and you can leave comments for each other attached to the report. You don’t just see the numbers, you see what other people are thinking about the numbers, and you can play with the numbers to answer all kinds of questions about how things are going and what should be done next. For an even deeper dive into this subject, check out my white paper, Are You Data Blind? How Good Data Visualization Delivers Business Solutions Faster.
As I mentioned in a previous blog post, a data visualization system should consistently show you things you had not thought of, or make you see your operations in different ways.
Take a look at these goal sets. The one on the left is generated by hand and the one on the right is from a DV program. Which set of goals seems clearer to you?
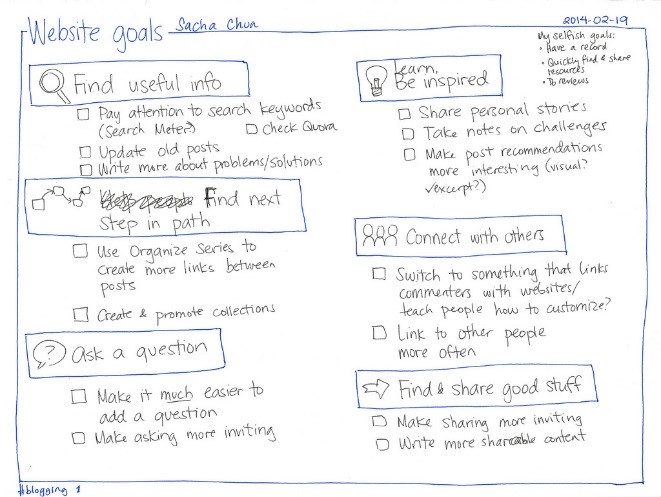
Handwritten goals (left) and DV goals (right). Image on left used under Creative Commons license. Image on right used under Fair Use: Copyright Free.
Data Visualization is Democratic
Good data visualization systems empower every user of the system with the ability to see the data they need to see, prioritize the data that is important to them, and effortlessly customize reports and displays. Each user is able to do their own data analytics without having to ask IT to generate reports or run scenarios. Each person can have the data that is important to them automatically surfaced to the dashboard without having to painfully extract that data from someone else’s report.
“[M]any non-technical professionals must now produce and comprehend insights from Big Data. Visualization can help.” Dorie Clark, Data Visualization Is The Future, Forbes
BI and DV are a windfall for large organizations. These sophisticated enterprise management systems help match the data with the decision, so that everyone at every level in the organization has the data they need to do their jobs at their fingertips. BI and DV unlock talent in organizations by allowing each person to do what they’re trained to do rather than have to also learn data analysis or rely on others to analyze their data. BI and DV are methods for optimizing talent and improving decision making.
Riding Data Visualization to Organizational Success
If you would like to get the benefits of data visualization and business intelligence systems, Datavail can help. We have experts in installing, maintaining and using a variety of BI and DV systems, include Oracle BICS, Tableau and Qlik. We are experts at setting up and testing systems, migrating data, and documenting ROI.
If you are using DV and you aren’t getting what you expected from the system, we can help. There are ways to maximize your data visualization investment to ensure you are getting the most out of what you’ve bought. Datavail has consulting experts with years of experience working with data visualization applications and building custom dashboards and reports. We can help you get better business solutions faster.
At Datavail, we have successfully completed DV and BI projects for customers large and small. Contact us today and get on the path to better visuals, better reporting, and better decisions.

Blog Author
Related Posts

How to Solve the Oracle Error ORA-12154: TNS:could not resolve the connect identifier specified
The “ORA-12154: TNS Oracle error message is very common for database administrators. Learn how to diagnose & resolve this common issue here today.

Data Types: The Importance of Choosing the Correct Data Type
Most DBAs have struggled with the pros and cons of choosing one data type over another. This blog post discusses different situations.

How to Recover a Table from an Oracle 12c RMAN Backup
Our database experts explain how to recover and restore a table from an Oracle 12c RMAN Backup with this step-by-step blog. Read more.