Tableau Integration & Data Visualization Services
Expert Business Intelligence and Analytics Solutions.
As an experienced provider of data warehousing, integration, and analytics solutions, Datavail is in a unique position to implement Tableau in organizations of all sizes.
What Is Tableau Data Visualization?
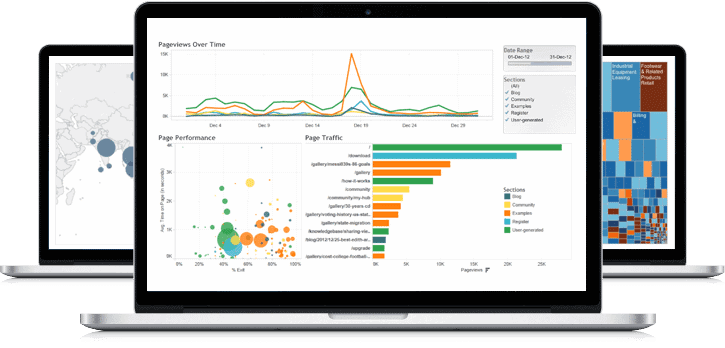
Tableau is a robust data visualization and dashboarding tool used in data analytics and business intelligence. It simplifies raw data by entering it into a format that is easier to understand, such as dashboards and worksheets, and is utilized by executives, leaders, decision makers, managers and individual contributors alike, including non-technical users without any programming skills.
Users can also create customized dashboards that meet their information and reporting needs, regardless of position and responsibility, company size, industry, department, team or sector.
Some of the benefits and features of Tableau software include:
- Data blending
- Real-time analysis
- Collaboration of data
By using visual features such as graphs, charts, and maps, Tableau dashboards provide simple and uncomplicated ways to view and understand patterns, trends and insights in data.
Tableau Data Visualization Best Practices
Datavail Tableau data visualization consultants ensure that when they consult with a company regarding its dashboards, the required relevant information is delivered to business stakeholders and decision makers, and that data visualization best practices are followed. They include:
Understanding the audience
Learning how and where dashboards will be viewed
Optimizing load times
Creating simple to understand dashboard formats
Testing dashboards for usability
Contact Us
* denotes a required field:

Partner with an Experienced Data Visualization Consultant
Allow Datavail’s business intelligence and analytics consultants to demonstrate the integration capabilities we can offer for Tableau. We will help you implement Tableau data visualization software, perform data integrations and verify the quality, consistency and reliability of the data, and help you build and customize intuitive dashboards that will bring your data to life.
Complete and submit the form on this page to contact one of our Tableau data analytics and visualization experts to learn more.
Most In-Demand Job in America? Data Visualization!
Work with Us
Let’s have a conversation about what you need to succeed and how we can help get you there.
CONTACT USWork for Us
Where do you want to take your career? Explore exciting opportunities to join our team.
EXPLORE JOBS